
Integration
Our WIW concept: Integration
Sustainability indicators can provide additional insights into long-term risks and opportunities that may be relevant to the valuation of companies. That is why we systematically incorporate sustainability factors into our investment analysis. In doing so, we examine, among other things, how companies deal with regulatory developments, environmental and reputational risks, and their ability to adapt to changing market conditions. Our analyses show that sustainability factors can make an important contribution to assessing long-term corporate developments.
According to our analysis, companies that systematically integrate sustainability considerations into their business models often exhibit characteristics such as:
- Less susceptible to regulatory changes
- Less frequently involved in environmental disasters
- Bearer of a higher public reputation
- More innovative and future-oriented
These findings are the reason why we consistently integrate sustainability criteria into our financial company analysis for liquid investments.
EB-ESG Score
Companies are evaluated holistically only when sustainability factors are taken into account
Investment decisions are based on weighing opportunities against risks. To assess companies comprehensively, it is essential to also take sustainability factors into account. Climate change, for example, affects every company directly or indirectly: On the one hand, companies can be impacted by production losses resulting from natural disasters (physical risks). On the other hand, their profitability can be affected by regulatory changes, such as an increase inthe price of CO2(transitional risks).
Our EB-ESG Score combines a comprehensive fundamental sustainability assessment with an AI-powered, news-based sustainability indicator. This allows us not only to evaluate how companies have historically managed their materially relevant opportunities and risks, but also to take into account current events that could negatively impact the company’s valuation. The EB-ESG Score’s functionality is illustrated by the example of the U.S. railroad company Norfolk Southern Railway.
On February 3, 2023, a freight train operated by the company derailed near the town of East Palestine in the U.S. state of Ohio, caused by an overheated wheel bearing. Twenty of the train’s 151 cars contained various highly toxic chemicals. After the derailment, a fire broke out that burned for nine days. Large quantities of the chemicals were released during firefighting efforts. Some of the chemicals were burned off in a controlled manner. In addition to air pollution immediately following the accident, spilled chemicals entered surrounding waterways, killing thousands of fish and aquatic organisms. Between 2023[1] and 2025, repeated efforts were made to clean up the waterways. In addition, soil in the area of the derailment was excavated over a large area and disposed of. According to the U.S. Environmental Protection Agency, the cleanup work was completed in early 2026; the site has been monitored ever since. In 2023[2] and 2024[3], Norfolk Southern incurred a total of $1.5 billion in costs related to the accident. This enormous financial burden on the company resulting from the environmental disaster is also reflected in its stock price (see Figure 1).
Figure 1 : Example: Norfolk Southern. Author’s own calculations, period: September 1, 2022–August 31, 2023. Data: Bloomberg, MSCI, and RepRisk. As of July 31, 2026.
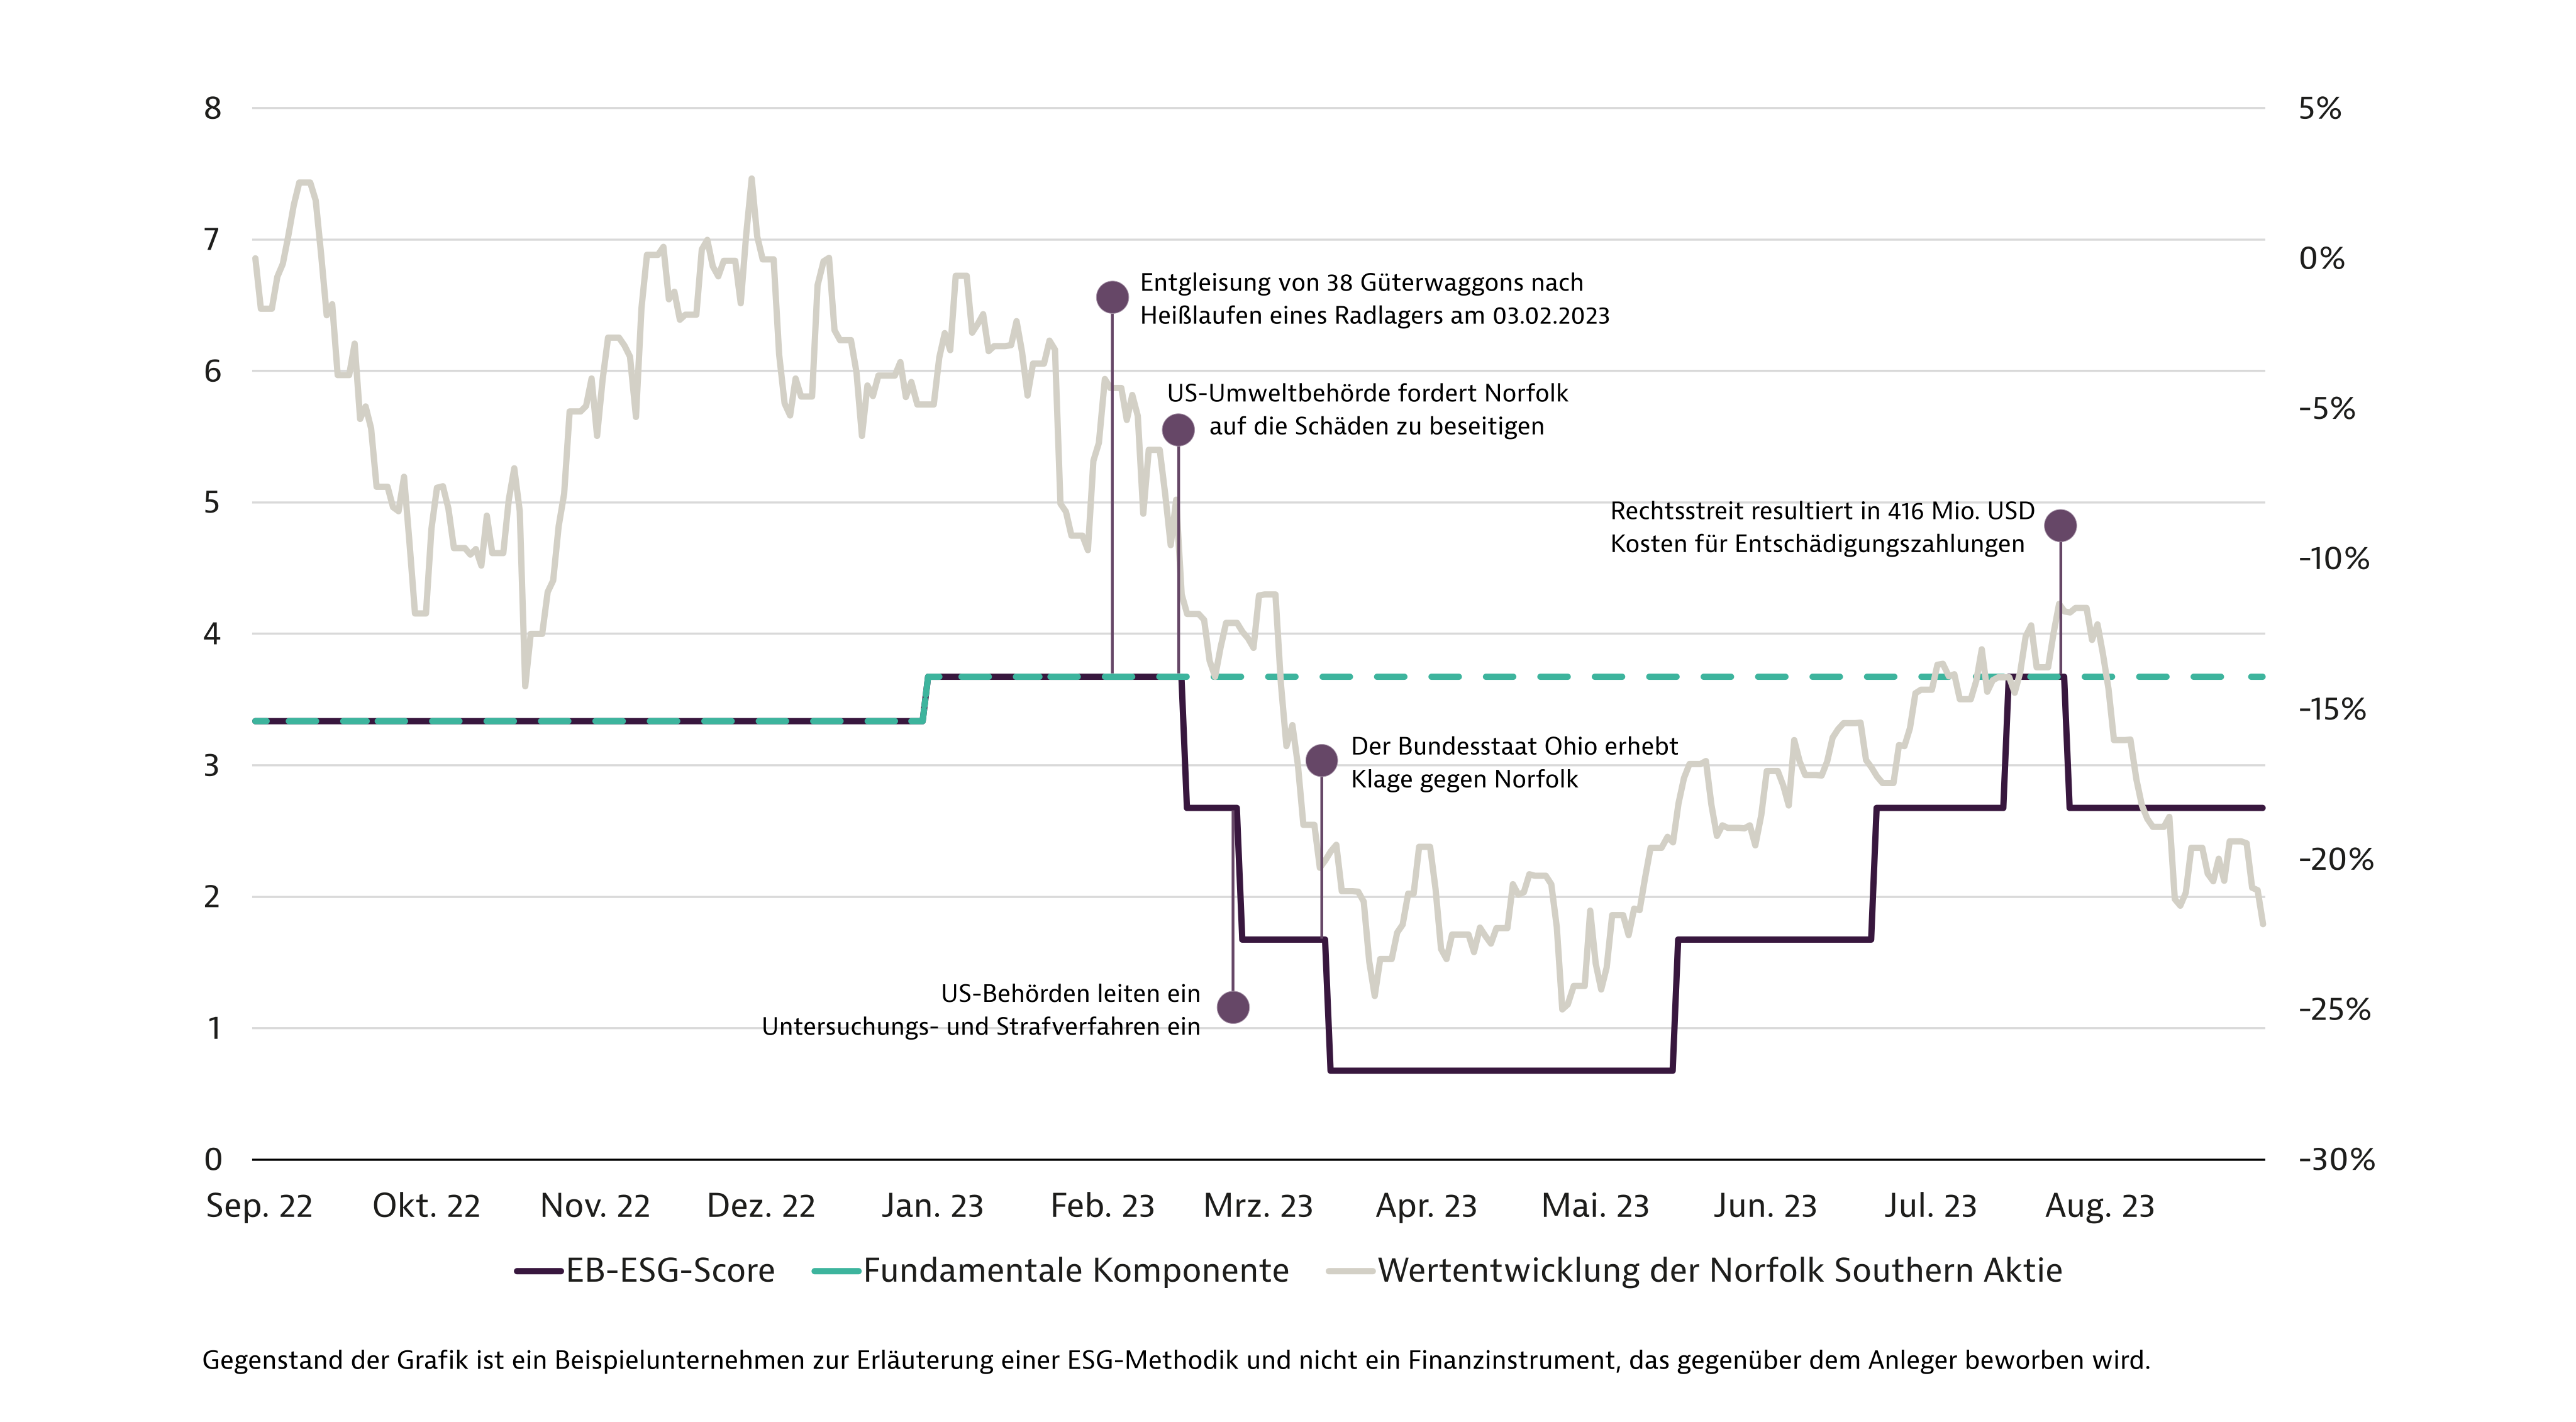
This example clearly illustrates why we combine fundamental sustainability data with AI-powered news data in the EB-ESG Score. Although the fundamental component already highlights the company’s elevated sustainability risks in the run-up to the disaster, it is only through the combination with the news-based sustainability indicator that the environmental disaster is reflected in the EB-ESG Score in a timely manner. As a result, the score reacts extremely promptly to relevant current events, thereby enabling a timely, holistic analysis. This allows for well-informed decisions to be made in a timely manner regarding how to proceed with a company in which an investment has been made.
Lower Portfolio Risks Thanks to Sustainability
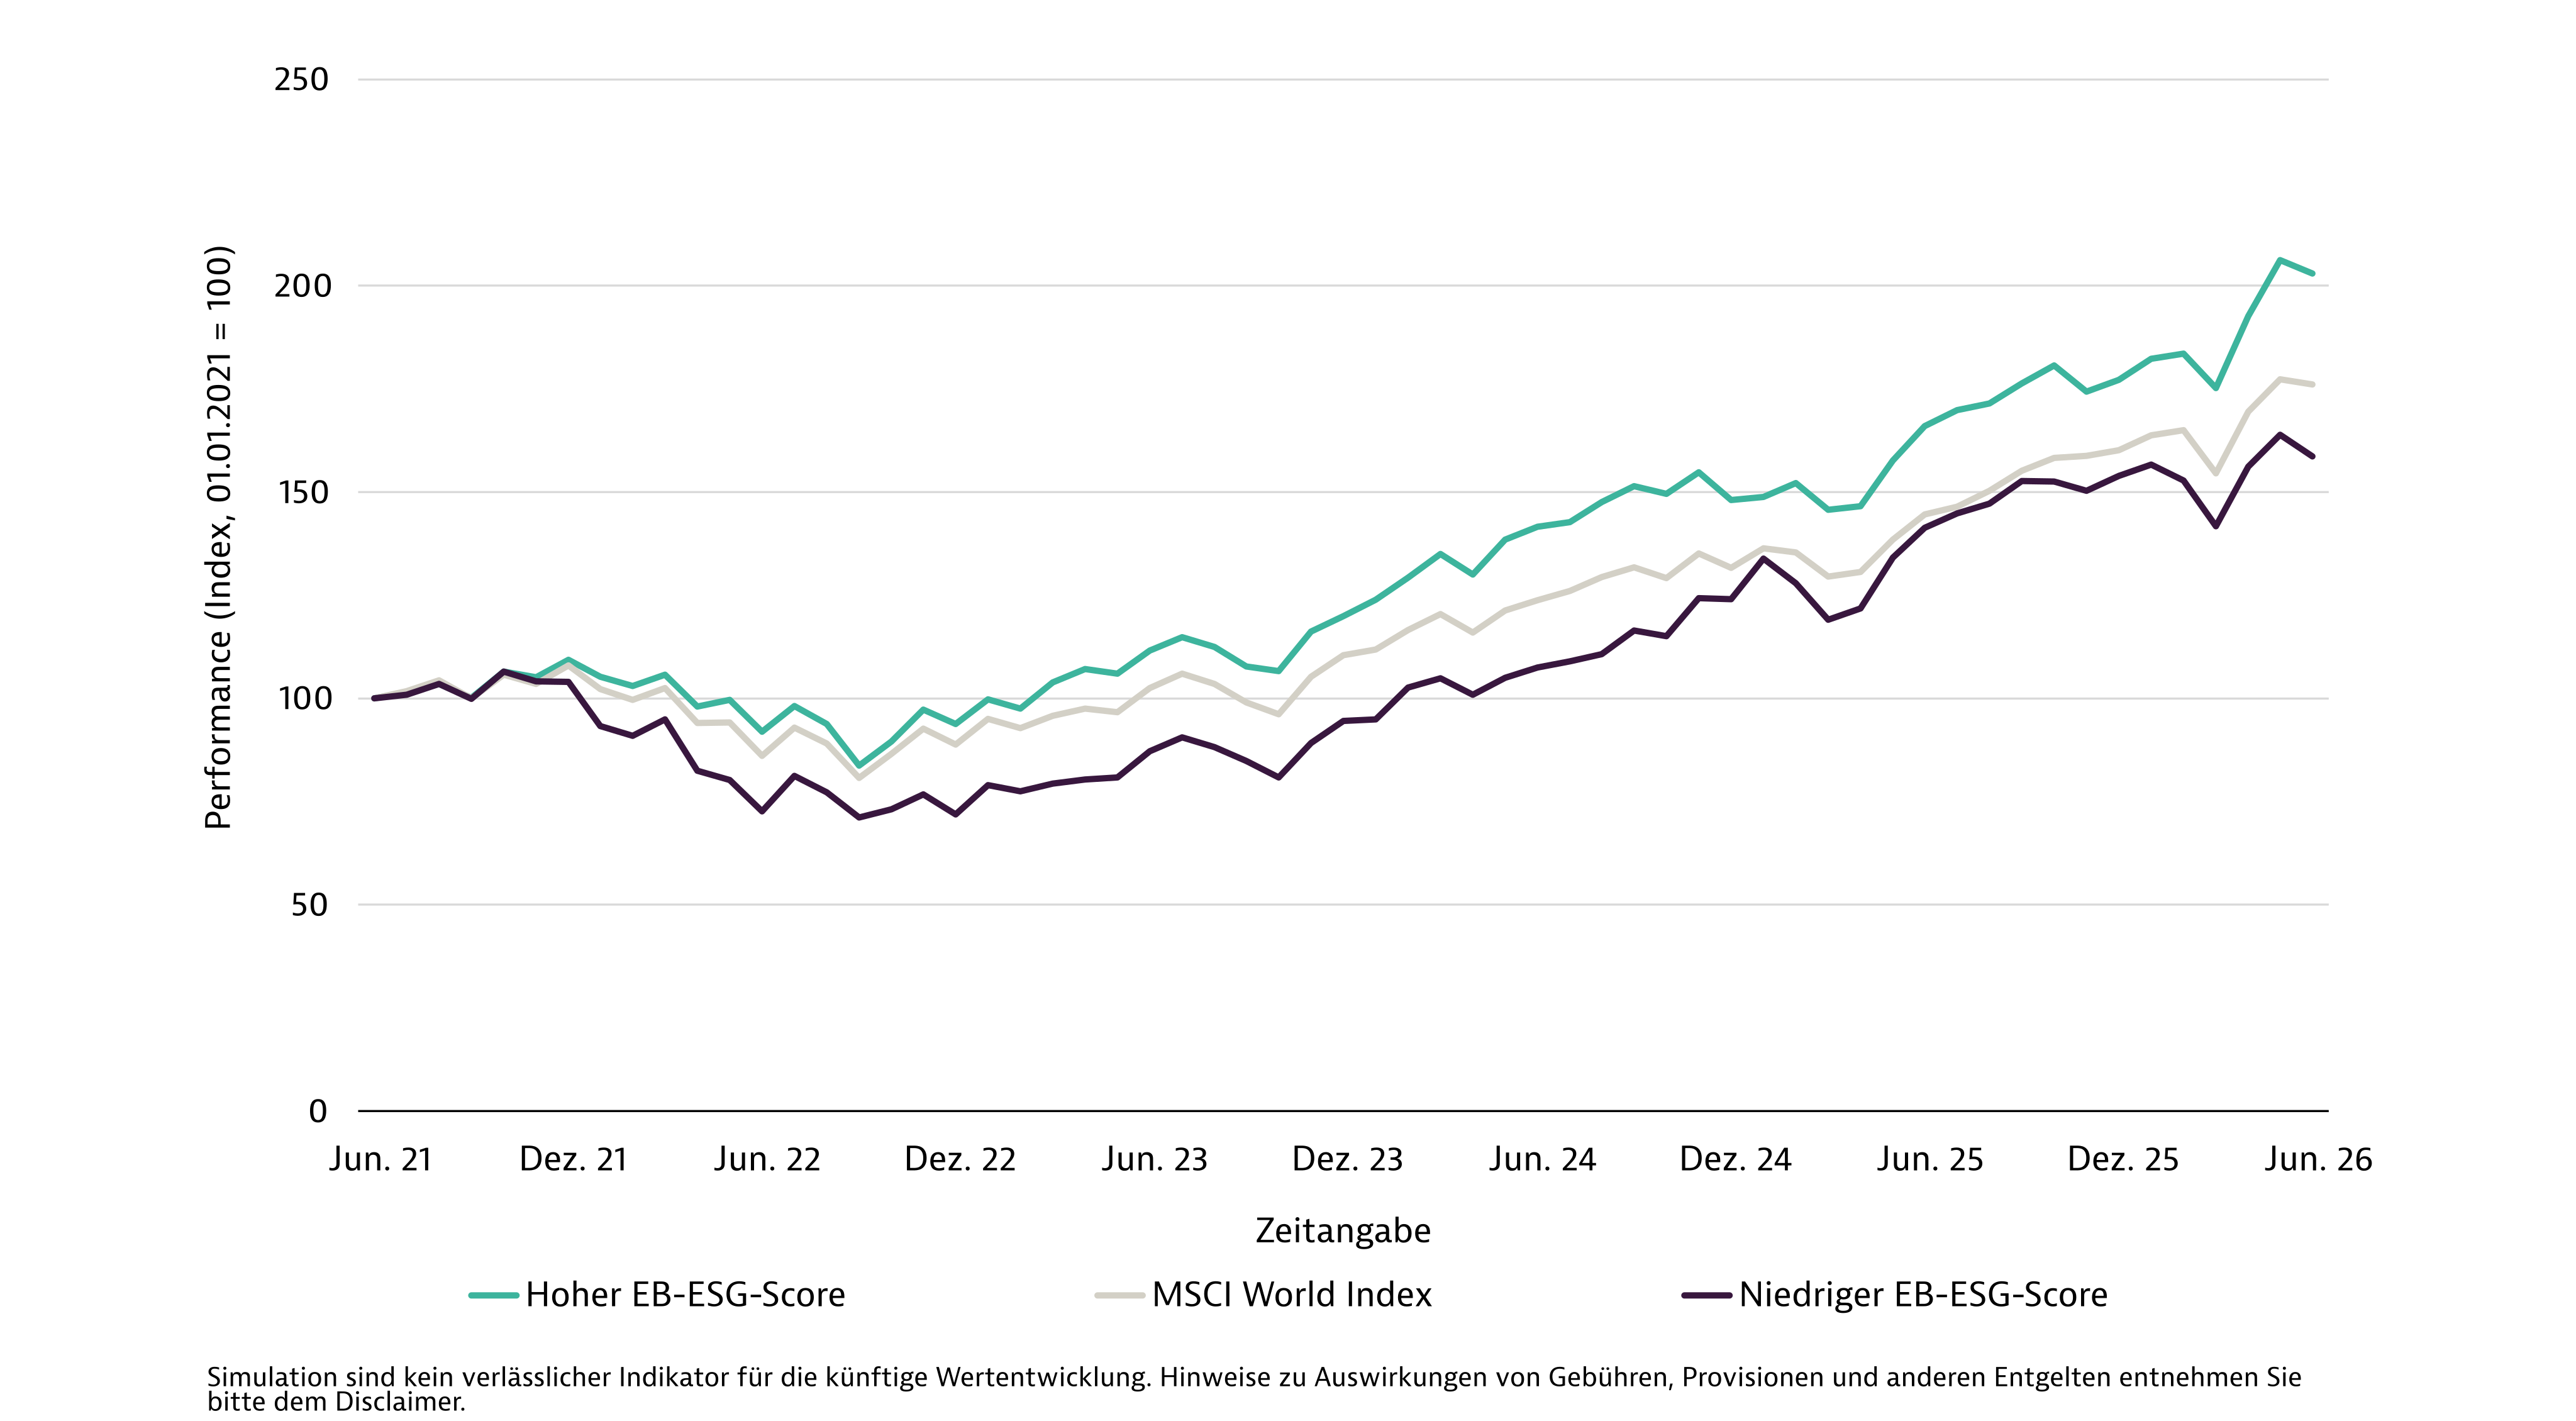
To demonstrate that incorporating the EB-ESG score into the investment process adds value, we constructed a sustainable portfolio and a non-sustainable portfolio (see Figure 2). To do this, we assigned the top 20 percent and bottom 20 percent of companies by EB-ESG score from the MSCI World Index to each portfolio. Both portfolios have the same sector allocation. The figure shows that, over the period under review, the “High EB-ESG Score” portfolio not only suffered no return disadvantages but also outperformed both the MSCI World Index and the “Low EB-ESG Score” portfolio.
Figure 2 : Comparison of Performance. Author’s own calculations, period: June 1, 2021–June 30, 2026. Data: Bloomberg, MSCI, and RepRisk. As of July 31, 2026.
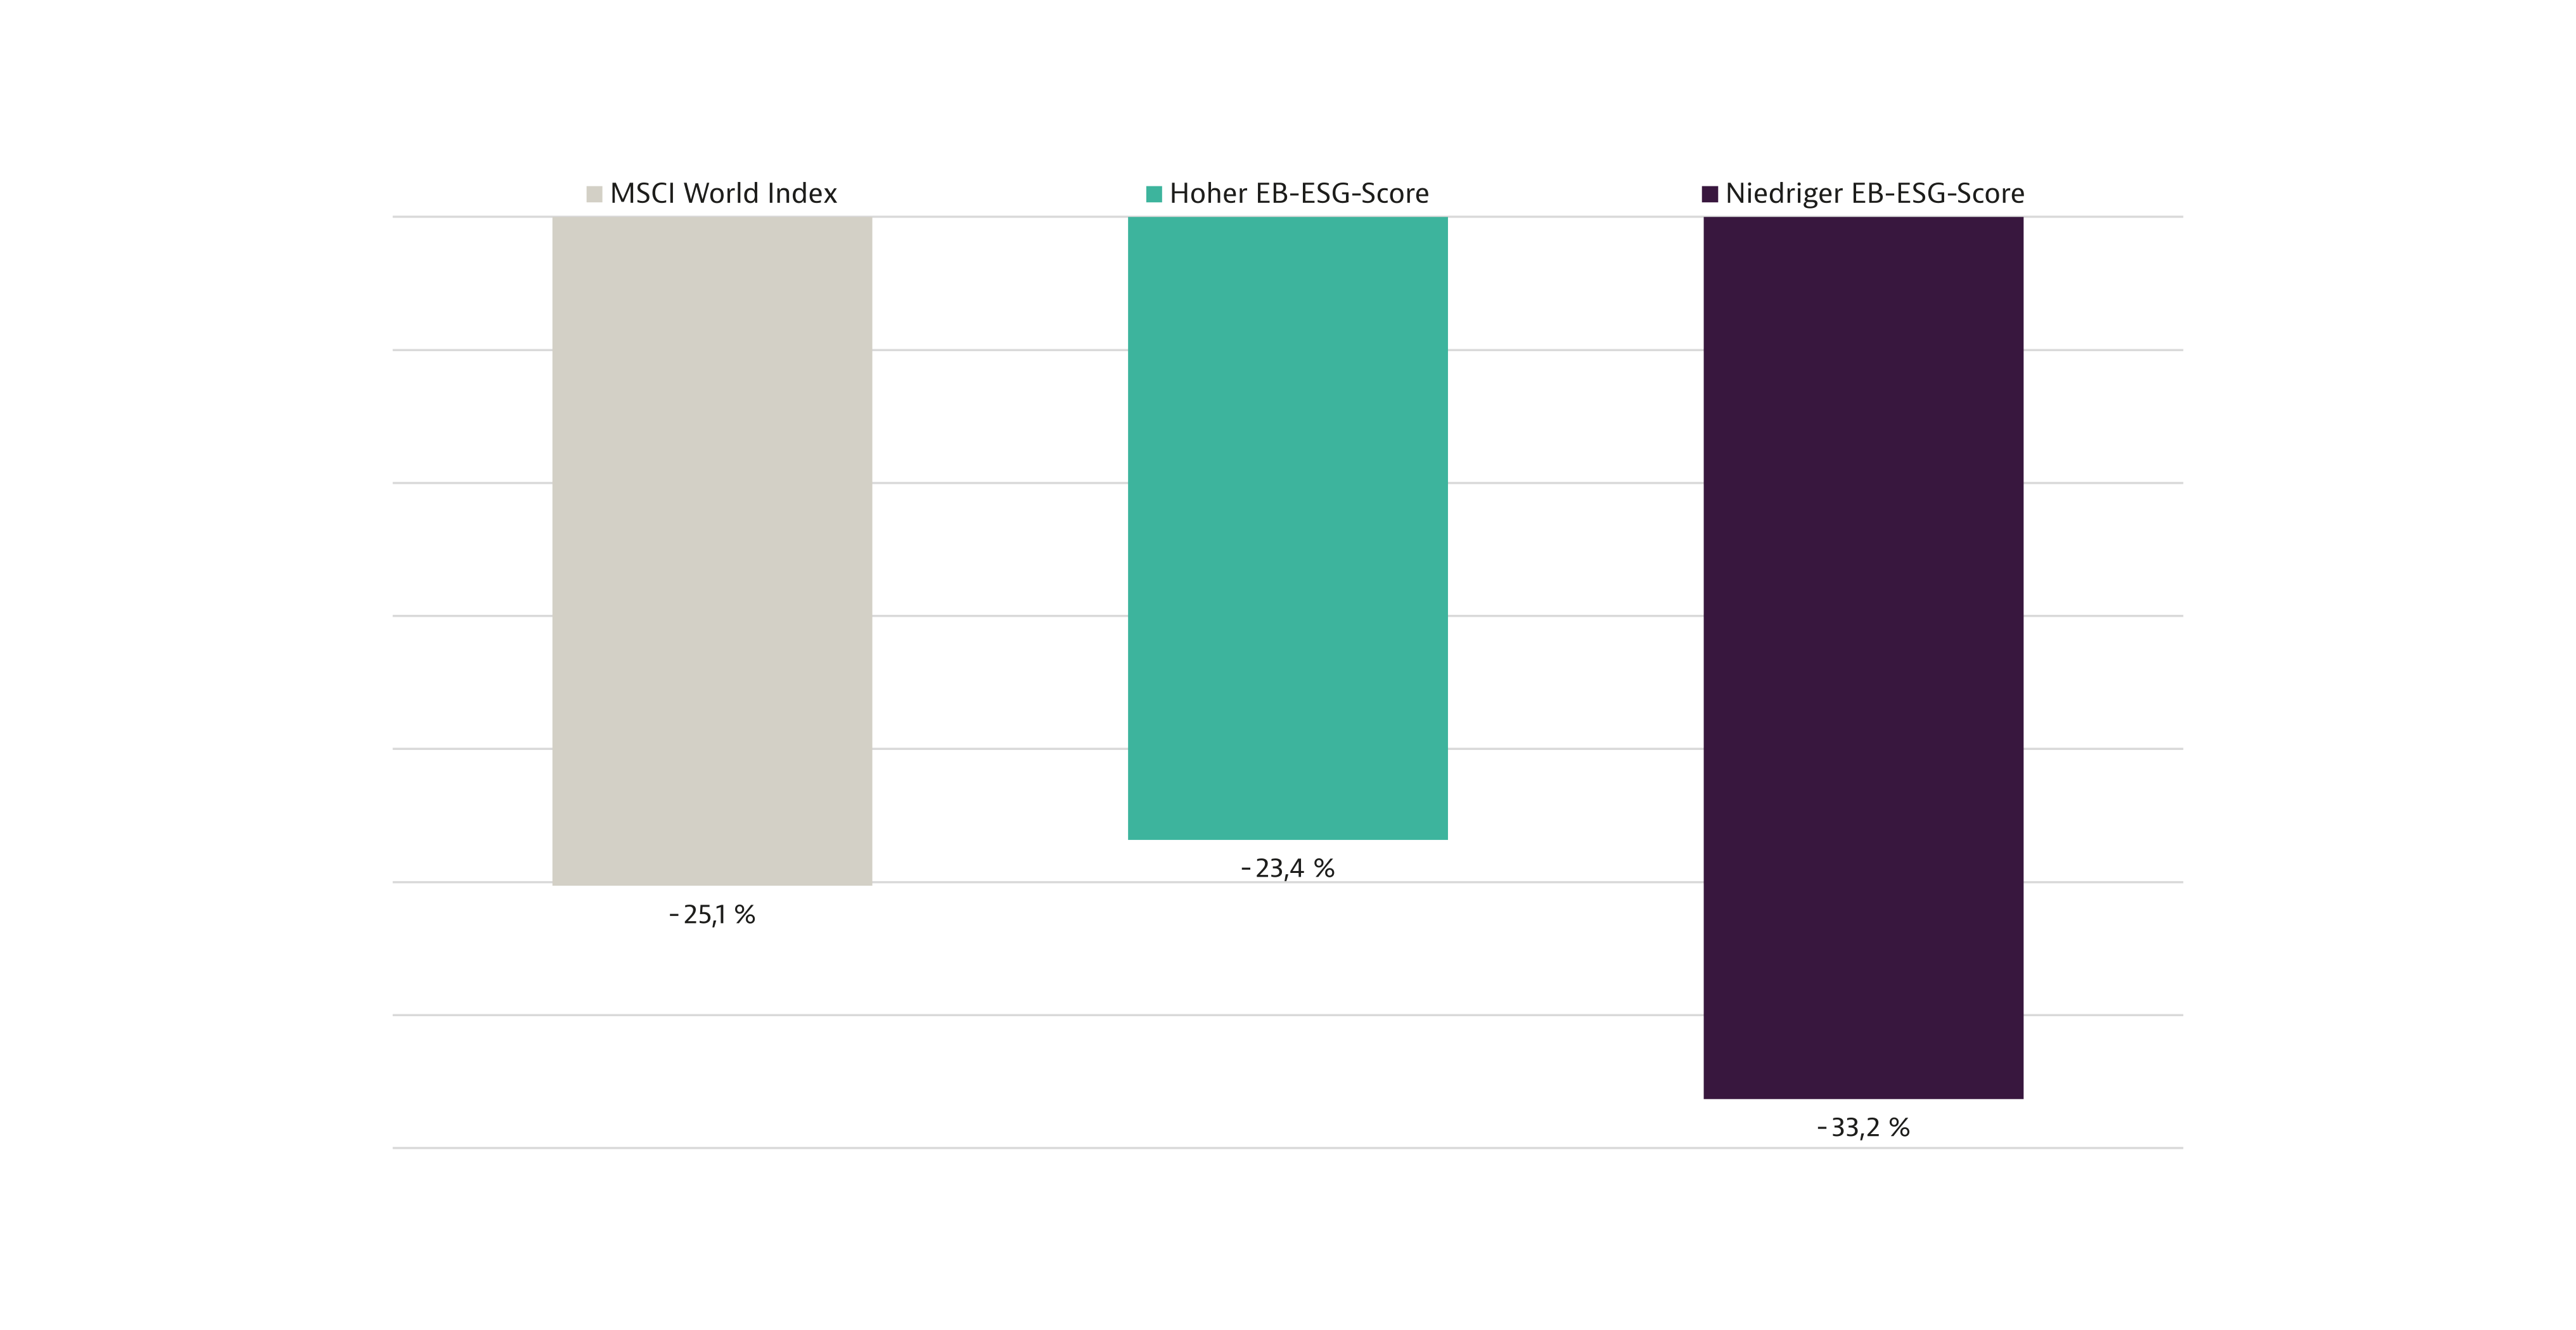
Furthermore, an analysis of the portfolios’ maximum loss in value shows that incorporating the EB-ESG score into portfolio construction adds value to risk management (see Figure 3). The “High EB-ESG Score” portfolio suffered the smallest maximum price decline, while the “Low EB-ESG Score” portfolio recorded the sharpest drop. Thus, the “High EB-ESG Score” portfolio not only achieved a higher return but also exhibited a better risk profile than the “Low EB-ESG Score” portfolio and the initial universe.
Figure 3 : Maximum loss in value. Author’s own calculation, period: June 1, 2021–June 30, 2026. Data: Bloomberg, MSCI, and RepRisk. As of July 31, 2026.
Fundamental component
The fundamental component of the EB-ESG score takes into account company-specific ESG risks and opportunities, as well as how companies address them. We consider factors from the areas of Environment—such as greenhouse gases, raw materials, or waste—Social—such as occupational safety, supply chains, or data protection—and Governance—such as compensation structures or tax transparency. For the fundamental component, we use LASSO regression to calculate individual weights for each sustainability indicator that reflect the financial materiality of the data (so-called materiality-weighted scores). As a result, social factors are given greater weight for labor-intensive companies, for example, while environmental factors are given greater weight for companies with potentially high environmental impacts. In this way, we ensure that only financially relevant sustainability data is used and reduce the risk of important data points being diluted in the aggregated score (see Giese et al., 2019)[4]. The weight of each sustainability dimension (environment, social, and corporate governance) is capped at between 10% and 60%. This prevents any single pillar from dominating the aggregated score. [5]
Sentiment Component
For the news-based sentiment component, more than 2,000,000 news articles from over 150,000 public news sources in more than 30 languages are analyzed daily. This process searches for information on risk events across more than 80 subject areas. Similar to our fundamental component, these risk events are categorized into the areas of environment, social issues, and corporate governance. Examples of risk events include environmental pollution, human rights violations, cyberattacks, child labor, discrimination, corruption and bribery, greenwashing, working conditions, and tax evasion.
The analysis is structured around events and issues. This means that, in the more than 2,000,000 articles, the system first searches for negative events and then, in a second step, identifies which companies are involved in those events. This is done using a machine-learning model that, in addition to categorizing topics and identifying companies, also provides an initial assessment of relevance and sentiment.
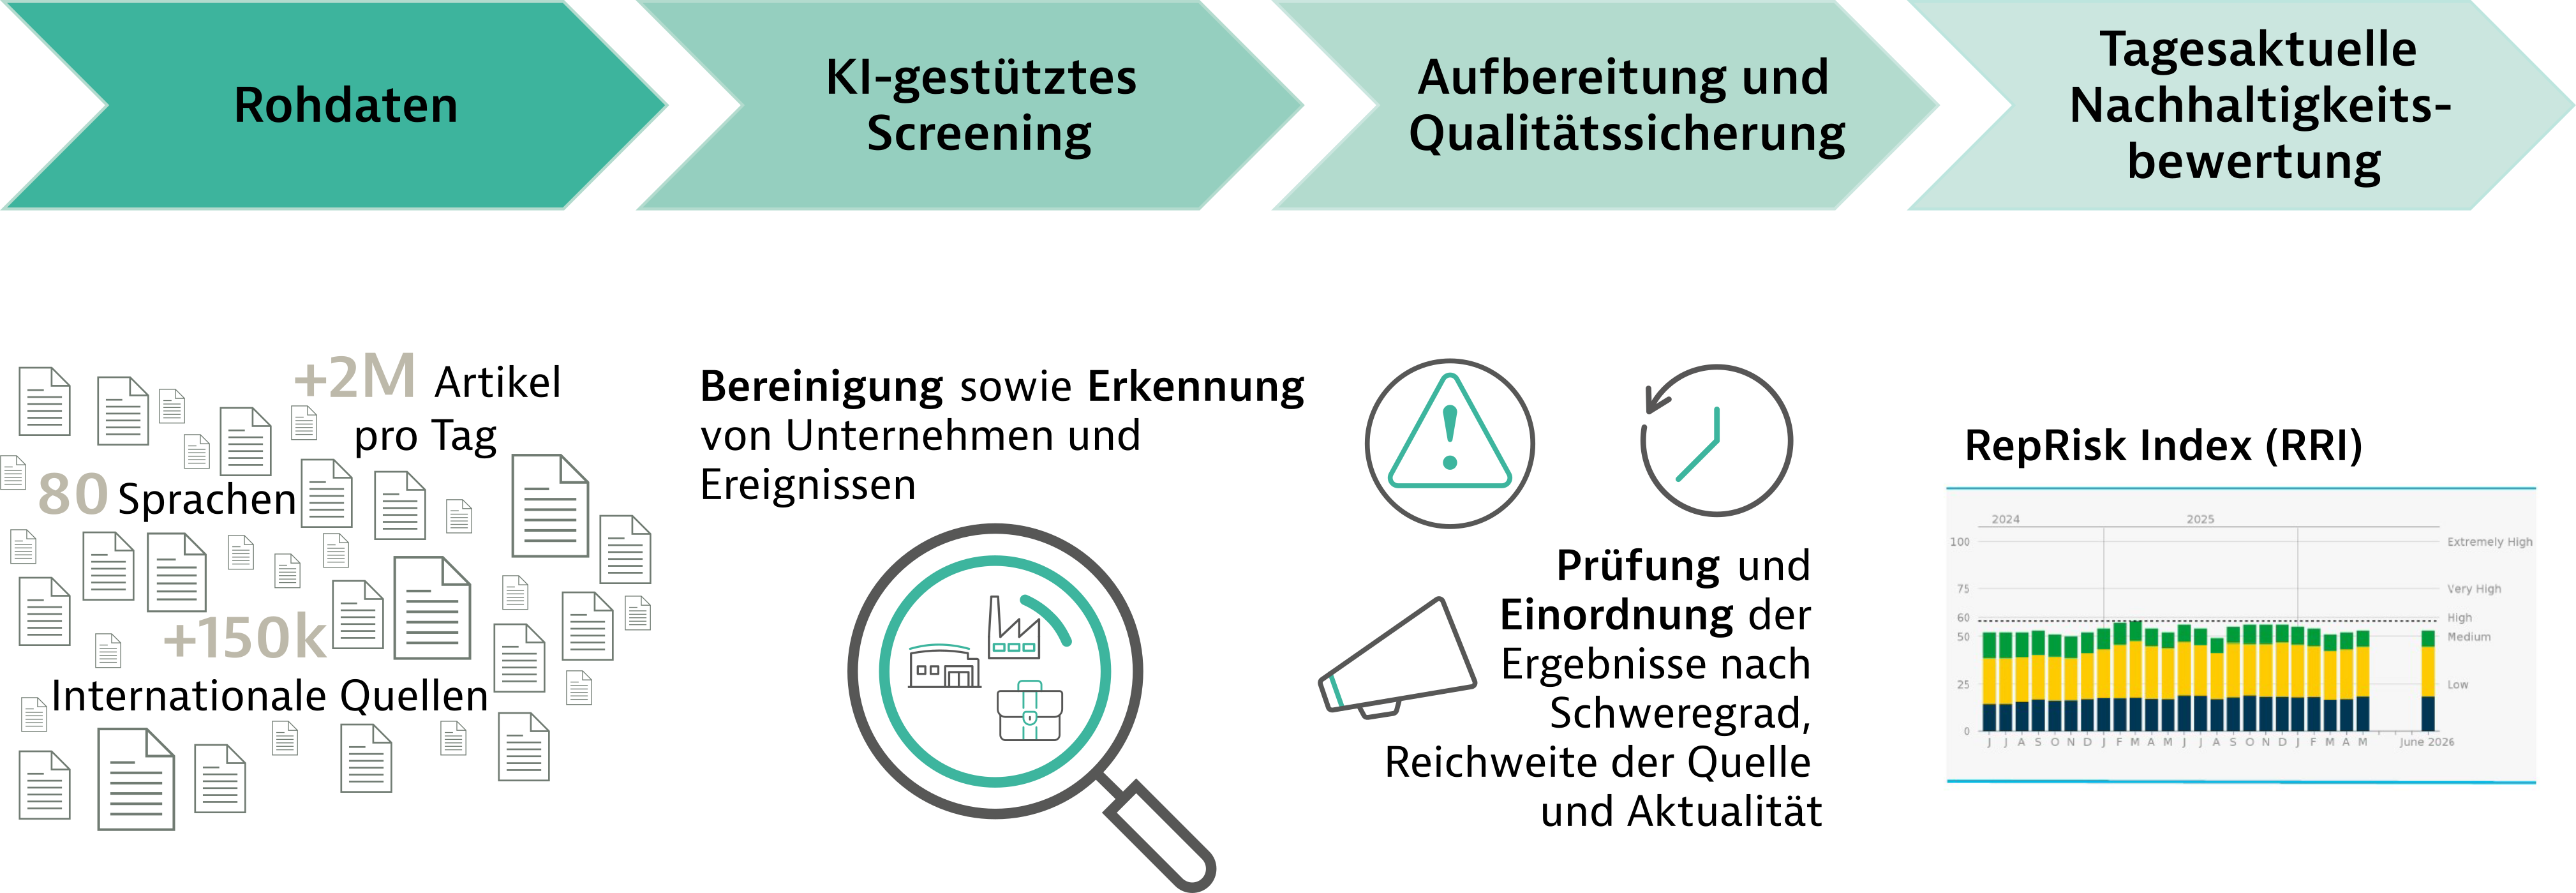
Each result is then reviewed and processed by a team of analysts. During this process, the analysts assess the severity of an event’s consequences, the reach of the information source, and the timeliness of the information. The resulting quantitative metric allows for an assessment of a company’s reputational risk. [6]
Interaction Between the Fundamental and News-Based Components
The EB-ESG Score enables a holistic view through its fundamental sustainability assessment combined with an AI-powered, news-based component. Deteriorations in a company’s sustainability are reflected in our combined score long before they would be detected in a purely fundamental sustainability analysis. In this way, the EB-ESG Score serves as an effective tool in our investment process and for our risk management. The sentiment component acts as an early warning system that temporarily downgrades the fundamental assessment in the event of emerging negative events or crises. This mechanism responds to sharp increases in negative media coverage of a company.
Legal notices:
This is a marketing communication and is intended only for persons who are resident or habitually resident in the Federal Republic of Germany. The contents of this document are for information purposes only. They do not constitute investment advice or a recommendation, nor do they represent an offer or advice regarding the purchase or sale of the fund. The sole binding basis for purchase is the sales documentation (key information document, prospectus, annual and half-yearly reports), which you can obtain free of charge on the relevant product page at https://eb-sim.de/uebersicht-investments/ . Please refer to the sales documentation for details of the opportunities and risks. A summary of your investor rights in German can be found at www.universal-investment.com/media/document/Anlegerrechte and/or https://www.ipconcept.com/ipc/de/anlegerinformation.html. The information contained in this document does not constitute a recommendation regarding investment strategy within the meaning of § 85 of the German WpHG. Past performance, forecasts and other simulations are not a reliable indicator of future performance. Performance is calculated using the BVI- method, excluding initial sales charges. Fund performance according to the BVI- method is the percentage change in the unit value between the start and end of the calculation period. This assumes that any distributions are reinvested. For an investment of EUR 1,000.00 over a five-year investment period and an initial charge of 5 per cent, the investment return in the first year would be reduced by the initial charge of EUR 50.00, as well as by any additional individual custody fees incurred. In subsequent years, the investment return may also be reduced by any individual custody fees incurred. Information on sustainability-related aspects in accordance with Regulation (EU) 2019/2088 can be found on the relevant product page at https://eb-sim.de/uebersicht-investments/. The management company may decide to withdraw the arrangements it has put in place for the distribution of units in its collective investment undertakings, in accordance with Article 93a of Directive 2009/65/EC and Article 32a of Directive 2011/61/EU.
[1] East Palestine, Ohio Train Derailment, https://www.epa.gov/east-palestine-oh-train-derailment/operational-updates (U.S. EPA, 2026)
[2] Annual Report (Norfolk Southern Corporation, 2024)
[3] 2024 Annual Report (Norfolk Southern Corporation, 2025)
[4] Giese et al. (2019), “Foundations of ESG Investing: How ESG Affects Equity Valuation, Risk, and Performance”
[5] We obtain the raw data from MSCI (https://www.msci.com/)
[6] We obtain the sentiment component from RepRisk (https://www.reprisk.com/)